
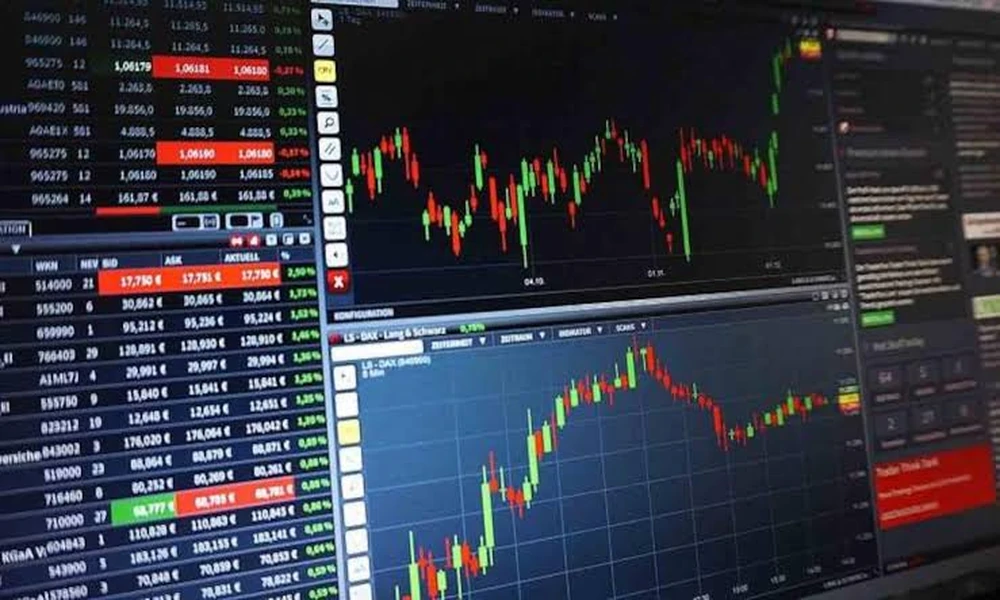
Markets rarely announce a turning point with certainty. A price may appear ready to reverse, only to continue moving in the same direction moments later. This is why experienced traders often look beyond a single candle formation or isolated technical signal. Identifying a potential shift is one task; confirming that buyers or sellers are genuinely taking control is another. Price action and volume can work together to provide that confirmation.
A practical approach begins with understanding that reversals are usually processes rather than single events. A market may slow down, test an important level, attract new participants, and then establish a new direction. Traders who combine price behaviour with participation data can develop a more structured view of these transitions. Rather than reacting to every apparent change, they can evaluate whether the market is actually demonstrating enough evidence to support a directional shift.
Why a Reversal Signal Is Only the Starting Point
Candlestick formations can provide useful clues about changing market sentiment. A long rejection wick, engulfing candle, double top, or break of a recent swing can suggest that the prevailing trend is losing momentum. However, these formations do not guarantee that a reversal will follow. Markets frequently produce false signals, particularly around major economic announcements, low-liquidity periods, or heavily watched support and resistance zones. Treating every formation as a confirmed reversal can therefore expose traders to unnecessary entries and premature exits.
A more reliable process considers what happens around the signal. Suppose an asset has been declining and forms a bullish reversal pattern near established support. The pattern may indicate that sellers are encountering resistance, but confirmation requires additional evidence. Traders can examine whether price subsequently breaks a meaningful swing high, holds above the support area, or establishes higher lows. These developments suggest that the market structure may be changing rather than simply experiencing a temporary bounce.
This is where a broader understanding of a reversal pattern becomes useful. Instead of viewing a pattern as an automatic trading instruction, traders can treat it as an invitation to investigate market context. The location of the formation, the preceding trend, nearby liquidity, volatility, and subsequent price behaviour all influence its significance. This approach aligns with a widely used principle in technical analysis: individual indicators are generally more informative when they are interpreted alongside other forms of evidence rather than in isolation.
Using Price Structure to Confirm Directional Change
Price structure provides one of the clearest ways to determine whether a possible reversal is developing into something more meaningful. In an uptrend, markets typically produce higher highs and higher lows. A potential reversal becomes more credible when that structure begins to deteriorate, such as when price fails to establish a new high and subsequently breaks an important higher low. The opposite applies to a downtrend, where a sequence of lower highs and lower lows may weaken when buyers push price above a significant lower high.
Key levels deserve particular attention because they provide context for the movement. A reversal occurring directly beneath major resistance has different implications from one developing after price convincingly breaks that resistance. Likewise, a bullish signal at established support can become more significant if buyers defend the level repeatedly. Traders can therefore focus on whether price is merely touching an important zone or actually demonstrating acceptance beyond it.
How Volume Adds Context to Price Movement
Price shows what the market is doing, while volume can help traders assess the level of participation behind that movement. A sharp price advance accompanied by noticeably stronger volume can indicate increased activity supporting the move. Conversely, a price breakout that occurs on weak participation may deserve greater scrutiny because it could lack sufficient conviction. Volume should not be interpreted as proof of future direction, but it can add valuable context to a price-based analysis.
The relationship between price and volume is often more informative than either measure alone. Consider a market approaching resistance after a prolonged decline. If price breaks through the level while volume expands significantly, the move may indicate stronger participation than a breakout occurring on unusually quiet activity. Similarly, if selling pressure appears to be fading while volume increases during bullish price action, traders may have additional evidence that market participation is changing.
Volume analysis also requires awareness of the instrument and trading environment. Centralised markets such as equities and futures generally provide more standardised volume data than decentralised markets such as spot foreign exchange. Traders should understand what their volume measure represents before incorporating it into a strategy.
Conclusion
Market turning points are rarely confirmed by one signal alone. A candle formation can highlight a potential change, price structure can reveal whether the trend is genuinely weakening, and volume can provide additional insight into participation. When these elements point in the same direction, traders have a stronger analytical foundation than they would from relying on a single visual pattern.
The most useful mindset is to treat confirmation as a process rather than a prediction. By studying how price behaves around significant levels, examining structural changes, considering volume, and maintaining disciplined risk controls, traders can approach potential reversals with greater clarity.